Biochar: the new black gold?

Raček, J.1, Ševčík, J.1, Chorazy, T.1, Kucerik, J.2, Hlavínek, P.1
1AdMaS Research Centre, Faculty of Civil Engineering, Brno,
University of Technology, Purkynova 651/139, 61200 Brno,
Czech Republic
2Faculty of Chemistry, Brno University of Technology,
Purkynova 118, 61200 Brno,
Czech Republic
1. Biochar as a resource: biochar quality
Biochar is the organic solid char product from biomass pyrolysis, i.e. thermal treatment in a substantially oxygen-free atmosphere. It has many potential uses, including as an adsorbent for pollutant removal, but its main projected application is in agriculture for soil amendment and fertilization, and possibly the more recent related application of green infrastructure.
Biochar can be generated from a variety of different feedstocks, both singly or in combination. The end use of biochar is dependent on its quality with reference to the level of contaminants, which then depends largely on the feed biomass quality.
When generated from a sewage sludge (SS) feed, which has a high mineral content, the biochar product tends to have a relatively high ash content combined with a corresponding low organic carbon content. Although it has a high nutrient content (i.e. phosphorus and nitrogen), and is thus a valuable fertiliser additive, its use for agricultural applications is determined by key physical and chemical parameters, in particular its morphology and harmful chemicals content.
Toxicants of concern include polycyclic aromatic hydrocarbons (PAHs), polychlorinated dibenzodioxins or dibenzofurans (PCDD/Fs), polychlorinated biphenyls (PCBs), xenobiotics, and the element As and heavy metals Cd, Cr, Cu, Pb, Hg, Ni and Zn. Threshold concentrations for these contaminants are imposed by two independent EU bodies (Table 1).
| Constituent/parameter | IBI A | IBI B | EBC Prem | EBC Basic |
|---|---|---|---|---|
IBI International Biochar Initiative; EBC European Biochar Certificate; PAHs polycyclic aromatic hydrocarbons total; PCDD/Fs for dioxins/furans; PCBs polychlorinated biphenyls; Corg organic carbon; PCDD/Fs in ng/kg | ||||
| Max concn, mg/kg DS | ||||
| PAHs total | 6 | 300 | 4 | 12 |
| PCDD/Fs | 17 | 20 | ||
| PCBs | 0.2 | 1 | 0.2 | |
| As | 13 | 100 | 13 | 13 |
| Cd | 1.4 | 20 | 1 | 1.5 |
| Cr | 93 | 100 | 80 | 90 |
| Cu | 143 | 6000 | 100 | 100 |
| Pb | 121 | 300 | 120 | 150 |
| Hg | 1 | 10 | 1 | 1 |
| Ni | 47 | 400 | 30 | 50 |
| Zn | 416 | 7400 | 400 | 400 |
| Other: | ||||
| Organic carbon Corg, % | >60 | >30 | >50 | - |
| H:Corg mol:mol | <0.7 | - | <0.7 | - |
| O:Corg mol:mol | - | - | <0.4 | - |
| SBET, m2/g | - | - | >150 | - |
2. Biochar generation
2.1 Pretreatment
Biochar generation from sewage sludge proceeds through:
- mechanical dewatering,
- thermal drying, and
- pelletization of SS with additives.
Dewatering and drying aim to minimise the moisture and maximise the organic carbon content, normally demanding chemical conditioning upstream of dewatering. The raw, dewatered and digested sludge organic solids content varies widely according to the feed sludge origin, degree of optimisation of chemical conditioning, and the dewatering technology employed. However, dewatering can generally achieve solids concentrations of around 25% DS (dry solids).
Drying aims to remove water while retaining the organic carbon. The most commonly used drying systems are fluidized convection ovens and belt dryers operating at temperatures of 75–90 °C. These generate powdered/granular solids having around 85–95% DS content with a bulk density of 400–900 kg/m3 depending on the particle morphology (Fig 1 a–b).
The optimal DS content for subsequent pelletization is ~88%. Pelletization (Fig 1c) eliminates dust, making handling safer, and permits blending with an additive to improve the downstream pyrolysis process and selected qualitative parameters of the biochar product.

2.2 Pyrolytic processes
Pyrolysis can be divided into four classes (Table 2) based on temperature and heating rate:
- flash pyrolysis
- fast pyrolysis
- slow pyrolysis, and
- torrefaction.
| Process | Temp, °C | Residence time, min | Gas | Liquid | Solid |
|---|---|---|---|---|---|
*Volatiles. Gaseous products otherwise pyrolytic gases | |||||
| Fast pyrolysis | 800–1300 | <0.1 | 40%* | - | 60% |
| Fast pyrolysis | 300–1200 | <0.33 | 15–25% | 50–70% | 10–30% |
| Slow pyrolysis | 100–1000 | 5–720 | 25–35% | 20–30% | 25–35% |
| Torrefaction | 200–300 | 30–240 | 20–40% | - | 60–80% |
The biochar yield generally decreases from torrefaction (60–80%), to flash pyrolysis (60%), to slow and fast pyrolysis (25–35% and 10–30% respectively). It has a significant inorganic content compared to corresponding biochar products generated from pyrolysis of flora-based biomass feedstocks.
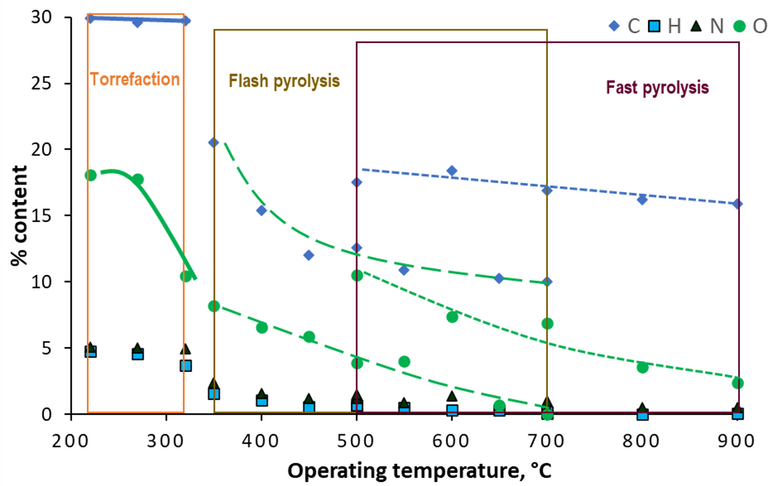
The carbon yield is significantly impacted by both the feed quality and the pyrolytic method. This is evident from a comparison of the outputs from three published studies:
- Torrefaction (220–320°C) of dried, anaerobically digested SS (Atienza-Martínez et al, 2015)
- Flash pyrolysis (350–700°C) of a dried mixture of raw and activated SS (Piskorz et al, 1986)
- Fast pyrolysis (500–900°C) of a 2:1 ratio of SS mixed with pine bark (Chen et al, 2014).
A review of the biochar data from the above studies (Fig. 2) indicates that:
- Low-temperature torrefaction provided a significantly greater biochar carbon yield than the pyrolysis methods conducted at higher temperatures.
- Over the same temperature range (500–700 °C) the carbon yield from flash pyrolysis of SS: pine bark mixture was consistently higher than that from flash pyrolysis.
- The H:C and O:C ratios both decreased with increasing temperature, and the H:C ratio was somewhat higher for flash pyrolysis than for fast pyrolysis.
- The mineral ash content of the SS-based biochars ranged from 67% to 89%, the proportion decreasing with increasing temperature.
Biochar yield decreased with decreasing temperature. In the case of the fast pyrolysis study the yield decreased from only 63% down to 53% between 500 and 900 °C (Chen et al, 2014), but by a significantly greater proportion (21% at 450 °C down to 11% at 650 °C) for the flash pyrolysis study (Piskorz et al, 1986).
The heavy metal content of the biochar proportionately increases with increasing temperature, also leading to a higher biochar alkalinity. However, it appears that the metals remain bound in the biochar and are not readily leached (Chen et al, 2014), presumably because of their decreased solubility in increasing alkaline environments.
2.3 Slow pyrolysis studies
A number of similar studies exist of the slow pyrolysis process at temperatures ranging from 300 to 750 °C, based on different SS matrices, heating methods – both conventional and microwave heating – and sample preparation methods. The following trends were generally observed:
- Biochar yields generally ranged between 40 and 70% (Zielińska et al, 2015; Hossain et al, 2011; Roberts et al, 2017; Ševčík et al, 2017). Yields from tests using microwave heating tended to be at the high end of this range (Ševčík et al, 2017), or beyond it (Antunes et al, 2017).
- The ash content increases with increasing temperature, generally exceeding 50%, while biochar yields decrease. The increased mineral hydroxide content correspondingly increases the biochar pH.
- Phosphate levels of 2−6% have been reported (Chen et al, 2014; Lu et al, 2013), the content increasing with increasing temperature (Lu et al, 2013). The nitrogen content, on the other hand, tends to decrease with increasing temperature.
- Aromaticity, reflected in the H:C ratio, ranges from as low as 0.16 at high temperatures (Zielińska et al, 2015) up to 1.76 for torrefaction (Atienza-Martínez et al, 2015).
- The reported biochar carbon content was generally in the range 15−40%, and decreased with increasing temperature. The organic carbon fraction, where measured, generally made up less than half of the total biochar carbon (Lu et al, 2013; Ševčík et al, 2017).
- Across those studies where results could be compared based on the operating conditions and feed sludge matrices employed (Lu et al, 2013; Hossain et al, 2011; Roberts et al, 2017; Zielińska et al, 2015), the relative biochar yield was found to decrease by 5−10% for every 100 °C change in reactor operating temperature (Table 3).
- Significantly higher yields were obtained by co-firing with a flora-based ('pruning waste') biomass (Méndez et al, 2013), or with granular activated carbon, GAC (Antunes et al, 2017).
- The specific surface area SBET varied by more than an order of magnitude across all studies, from 1 m2/g or less (Zielińska et al, 2015; Agrafoti et al, 2017) to >60 m2/g for microwave pyrolysis of SS with 10% GAC additive (Antunes et al, 2017). In the latter study, SBET increased with increasing temperature.
| Author | Absolute yield change | Yield range | Temp range |
|---|---|---|---|
| Zielińska et al, 2015 | 5% | 40−55% | 500−700 |
| Lu et al, 2013 | 2.5% | 7−15% | 300−600 |
| Agrafoti et al, 2017 | 21% | 22−63% | 300−500 |
| Hossain et al, 2011 | 20% | 52−72% | 300−600 |
| Roberts et al, 2017 | 19% | 48−67% | 300−750 |
| Roberts et al, 2017 | 26% | 44−70% | 300−750 |
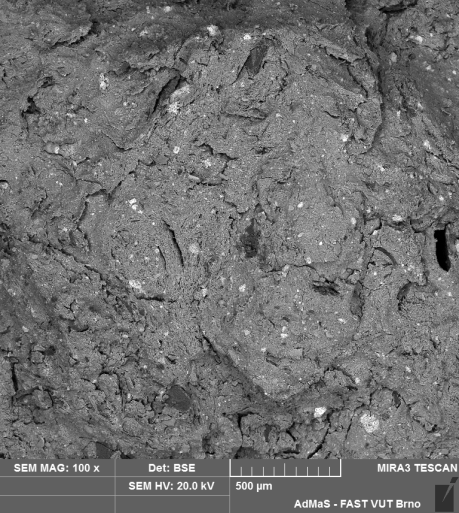
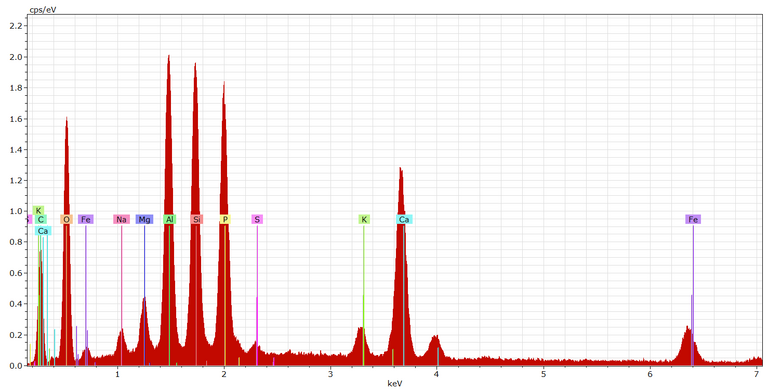
An analysis of the biochar by scanning electron microscopy (SEM) (Fig. 3) indicates white deposits within the biochar matrix. Analysis of these deposits by Energy Dispersive X-ray Analysis (EDAX, Fig. 4) shows these deposits to be predominantly silicates and aluminates (as inferred from the Si, Al and O peaks), as well as calcium carbonate and ferric hydroxide (Ca and Fe respectively).
2.4 Biochar application to agriculture
The key biochar properties regarding its potential use in agriculture are:
- the nutrient content (principally nitrogen N and phosphate P)
- the mineral ash content
- the toxic metals content
- the pH
- the organic carbon content, and
- the molar oxygen to organic carbon (O:Corg) ratio.
The N and P content both appear to be in the range 2−6 wt% across all studies. The mineral ash content generally ranges from 55 to 80% for the slow pyrolysis studies. The content is lower than this for torrefaction and higher for fast and flash pyrolysis due to the higher applied temperatures.
The available reported data for toxic metals indicates that their concentrations in the biochar tend to exceed the guidelines listed in Table 1. The data do not indicate a consistent impact of pyrolysis temperature on the biochar toxic metal content, notwithstanding the increasing pH. Despite this slightly elevated toxic metals content, it has been reported (Chen et al, 2014; Roberts et al, 2017) that the metals do not readily leach from the biochar.
According to the guidelines in Table 1, an organic carbon content above 30% along with a maximum molar O:Corg ratio of 0.4 are required. Given that the organic carbon appears to make less than half the total carbon, and the total carbon is generally below 60%, the organic carbon content stipulation is not met according to the outputs from most of the studies. However, since the O:C ratio is generally below 0.5, it can be assumed that the O:Corg ratio in the biochar is routinely below 0.4.
3. Conclusions
Biochar is the principal product formed from the pyrolysis of SS at low temperatures. It has potential use in agriculture provided it conforms to the compositional guidelines stipulated by the International Biochar Initiative and European Biochar Certification.
Reported studies of pyrolysis at low temperatures suggest that it is generally not possible to meet the recommended guidelines for the biochar organic carbon content of >30% (Table 1) when using a SS feed, nor, in most cases, meet the required limits for the toxic metal content.
Against this, it appears to be possible to generate a biochar product conforming to the guidelines if the sewage sludge is blended and co-fired with a biomass having a significantly high organic carbon content. There are also apparent efficiencies to be gained from the use of microwave heating, in that both the conversion to the biochar product and the biochar organic carbon content are increased when compared to conversion of SS alone using conventional heating.
In all other respects, and in particular the high nutrient content and low oxygen to organic carbon ratio, biochar appears to offer significant benefits for soil amendment and fertilization. Biochar addition to soil is also well known to increase its water retention, and to regulate the soil pH.
There are obvious potential benefits in the study of the blending of biomass and SS to generate a high-value biochar product of an acceptable chemical quality according to existing guidelines. Moreover, interest in the beneficial use of biochar in other areas – ranging from carbon dioxide sequestration to water treatment – is increasing as pressure on the instigation of the circular economy continues to mount.

