Sludge separation − filtration

Introduction to filtration theory
Filtration theory as applied to sludge processing defines the way in which water flows through the bed, which is formed of the sludge solids – known as the cake. The key parameters of the theoretical description are the resistance of the cake to flow and the change in the cake resistance with time.
When water passes through a filter medium the relationship between the flow (the filtrate volume V per unit time t) and pressure drop ∆P is dependent on the hydraulic resistance of the filter medium Rm and the filter cake Rc. The general filtration equation can be expressed as:
where µ is liquid viscosity as before. If the equation is rewritten as:
then the two empirical constants K1 and K2 respectively represent the resistance of the cake and the filter:
where:
α is the specific resistance to filtration (SRF)
c is the concentration of solids in the feed, and
A is the filter area.
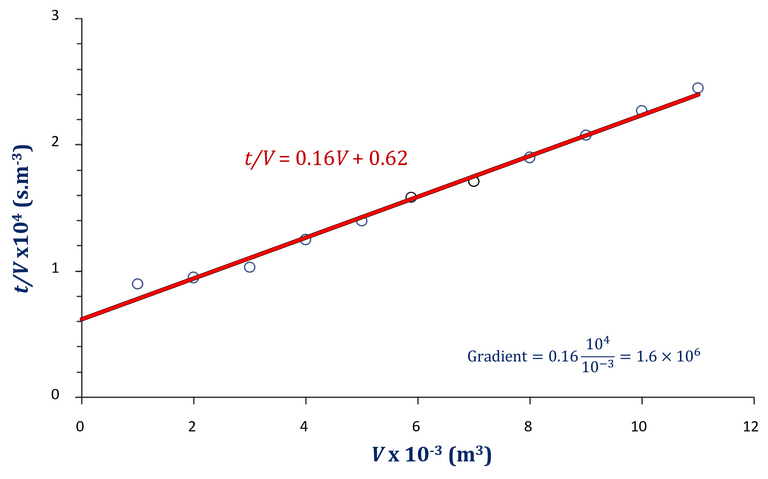
So, a plot of t/V against V yields α in the gradient, in accordance with Equations 2 and 3.
In practice, α is not constant because the cake tends to compress under pressure:
where n is the cake compressibility and α0 is the SRF at zero pressure (i.e. zero compression). The cake is therefore highly compressible at values of n approaching unity and largely incompressible at values close to zero.
Therefore, if filtration is carried out at different pressures, the value of K1at each pressure can be obtained from plotting t/V against V (Equation 2), thereby allowing α
to be determined as a function of ∆P. The cake compressibility can then be determined from Equation 5 by producing a log:log plot.
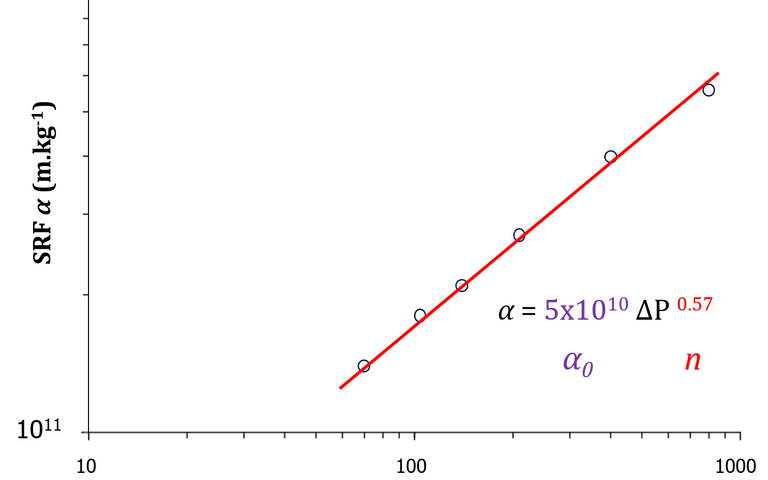
Filtration tests conducted at different pressures can therefore provide information about the sludge filterability by establishing the cake compressibility, as well as determining the SRF at zero compression (α0). This can inform the overall pressure required to achieve a target cake solids concentration.
In practice, the pressure:flow relationship is more complicated than that indicated in Equations 1−5 due to:
- the time-dependency of compression: the cake does not necessarily reach the equilibrium compressibility value within the timescale of the experimental measurement, and
- the sludge particle size distribution: sludges contain particles over a significant size range, i.e. they are heterodispersed; the smaller particles can migrate through the cake and cause significant changes in the regional solids concentration and pressure drop throughout the depth of the cake.
As with the sedimentation velocity measurement, measurement of α and n only provide an indication of filtration behaviour at full scale but can nonetheless be used for assessing relative performance across a range of pressures and cake bulk solids concentration values.

