Microwave drying of sewage sludge: performance and energy demand

Eva Kocbeka,b,c*, Hector A. Garciab, Christine M. Hooijmansb, Ivan Mijatovićc, Branko Lahd, Damir Brdjanovica,b
a Department of Biotechnology, Delft University of Technology, Van der Maasweg 9, 2629 HZ, Delft, The Netherlands
b Department of Water Supply, Sanitation and Environmental Engineering, IHE-Delft Institute for Water Education, Westvest 7, 2611 AX Delft, The Netherlands
c Tehnobiro d.o.o., Heroja Nandeta 37, 2000 Maribor, Slovenia
d Central wastewater treatment plant Ptuj, Ob Dravi 7, 2250 Ptuj, Slovenia
* Corresponding email address: info@tehnobiro.eu
1. Introduction
Microwave (MW) drying of mechanically-dewatered sewage sludge presents an alternative to the conventional convective and conductive thermal drying technologies, employing microwaves (MWs) at frequencies generally between 915 and 2,450 MHz. MW drying offers relatively high throughput capacities, faster process start-up and shutdown, effective pathogen inactivation, and is possibly viable at smaller scales than the conventional thermal drying processes. Its mode of operation means it is effective for selectively heating/removing dielectric materials such as water, offering potentially high energy efficiencies – especially when low-frequency (for example, 915 vs. 2,450 MHz) magnetrons with high MW generation efficiencies are employed.
However, studies have indicated that the process also appears to incur a relatively high overall energy consumption. This has been attributed to, among other things:
- unnecessary heating of the cavity and other components of the system
- ineffective extraction of the water vapour/condensate from the irradiation cavity, and
- other heat transfer inefficiencies (e.g. poor insulation, cold start-up, uneven MW energy and temperature distribution, and the absence of thermal recovery from the water vapour).
Some of these shortcomings can be addressed by combining MW radiation with hot air treatment, where the water evaporated by MW radiation is removed by a stream of hot air, avoiding condensation and subsequent solids rewetting and also promoting heating uniformity. Intermittent MW convective drying with hot air can be applied, as well as introducing travelling wave applicators and/or moving parts in the irradiation cavity.
Despite this, there are relatively few pilot-scale demonstrations of MW technology for sewage sludge drying. This study aimed to address some of the issues identified in i)−iii) above. The treatment performance of the pilot-scale MW system was assessed at different MW output powers, which determined the overall treatment/exposure times, the sludge drying rates, and the key system energy-related parameters.
2. Materials and methods
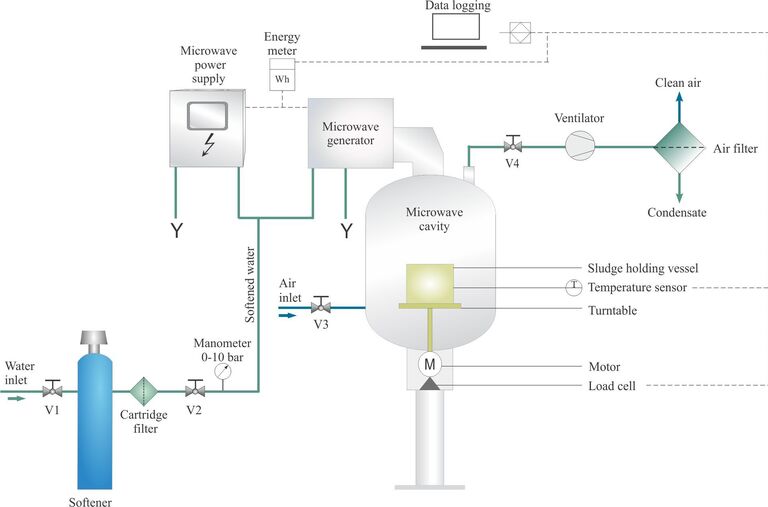
The study was based on centrifuged waste activated sludge (C-WAS), characterised in terms of total and volatile solids content (TS and VS respectively), calorific value (CV), and elemental sulphur (S), hydrogen (H), carbon (C) and nitrogen (N) levels (Table 1). The MW dryer (Fig. 1) comprised a stainless steel cylindrical cavity, with a polypropylene (PP) oval sludge-holding vessel of 6 kg maximum capacity, and a motorised PP turntable rotating the sludge sample at 1 rpm to promote uniform irradiation. The cavity was fitted with ventilation for extracting the condensate and a MW magnetron of 6 kW maximum output power at 2,450 MHz.
| Parameter (% unless stated otherwise) | Value |
|---|---|
a on dry solids (DS) basis | |
| Total solids (dry solids) | 17 ± 1 |
| Moisture content | 83 ± 1 |
| Volatile solidsa | 88 ± 2 |
| Ca | 46.5 |
| Ha | 5 |
| Na | 9.9 |
| Sa | 1.5 |
| Gross calorific valuea, MJ kg-1 | 18.4 |
All trials were conducted on C-WAS samples collected from a wastewater treatment plant (WWTP) on the day of the trial. MW output powers were increased from 1 to 6 kW at an initial sludge mass load and thickness of 3 kg and 60 mm respectively (Table 1). The test continued until the sludge moisture content reached ~0.18 kg per 1 kg dry solids-1 (i.e. 85% DS).
The recorded/calculated parameters comprised:
- the specific energy consumption (SEC) in MJ electrical energy consumed per litre water removed
- the specific energy output (SEO) in MJ microwave energy supplied to the MW unit per kg initial sample mass
- the specific energy input (SEI) in MJ electrical energy consumed per kg initial sample mass
- the energy efficiency μen in terms of the theoretical energy required to thermally remove the water (given by its specific heat capacity and latent heat of evaporation) compared to the energy delivered
- the MW generation efficiency μgen, given by the ratio of the MW energy output and input
- the drying rate DR in kg water removed per unit time, and
- the power absorption density Pd, i.e. the amount of power absorbed per unit initial sludge volume.
3. Results and discussion
3.1 Drying rates and exposure times
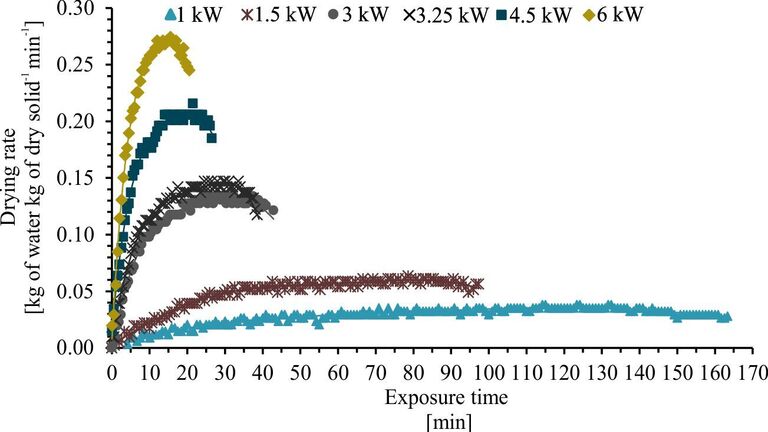
The sludge drying characteristics for reducing the moisture content from 4.88 to 0.18 kg/kg DS (corresponding to a DS increase from 17% to 85%) at 1−6 kW output MW power values are shown as:
- moisture content with time (Fig. 2)
- drying rate with time (Fig. 3)
- drying rate with moisture content (i.e. Krischer curves, Fig. 4).
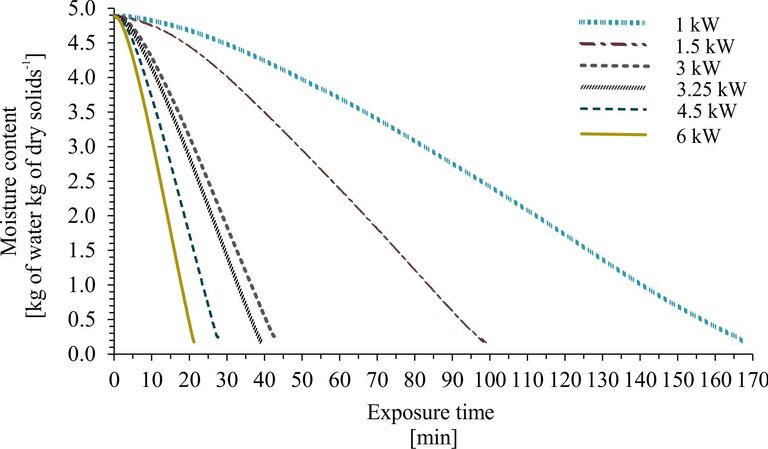
As expected, the required exposure time decreased with increasing MW output power (Fig. 2) and the drying rates increased commensurately from 0.03 to 0.28 kg of water per 1 kg of dry solids-1 min-1
(Fig. 3). In the Krischer curves (Fig. 4) the trend is in the reverse direction of the transient (Fig. 3): the highest x-axis value corresponds to the initial condition and the lowest value to the end of the test. Figure 4 displays the three drying regions of (i) initial drying rate adaptation, (ii) constant rate drying, and (iii) falling drying rate, with the latter more discernible at the higher MW power output values.
The drying rate adaptation period is depicted as a steep curve on the left-side and right-side of Figures 3 and 4 respectively. This lasted for ~34% of the exposure time at all the evaluated MW power values up to a sludge moisture content of ~3.8 kg of water per kg DS, or 21% DS (Fig. 4). Following the adaptation period the sludge drying rate remained largely constant until almost the end of the drying process for all but the highest applied power.
The MW radiation of sludge resulted in a prolonged constant rate drying period as a function of the moisture content, as distinct from the classical drying curve for thermal processes which generally shows a steep decline during falling rate period. It has been previously observed that falling rate drying periods arise when the sludge moisture content drops to 0.7 kg of water kg DS-1 min-1 and below. This drying trend indicates that the surface of the sludge is no longer completely wet, such that the rate at which water is transported to the sludge particle surface from the bulk is less than the surface evaporation rate.
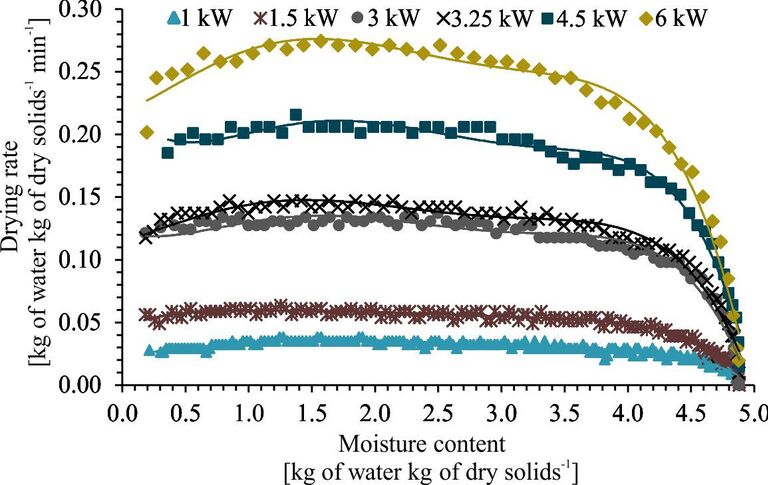
This being the case, it might be expected that extending the constant rate drying period to lower moisture contents would improve energy efficiency since the energy required to remove water from the bulk of the material (i.e. during the falling rate period) is greater than that needed to evaporate the water from the surface.
The flat trends shown in Figure 4 generally arise for MW drying due to the inverted drying temperature profile, where the water within the particle is heated directly. There is therefore a corresponding increase in the internal pressure within the particle, forcing the water to the surface where it is evaporated. This is to be distinguished from conventional thermal dryers where the heat is provided externally and so has to be transferred from the particle surface to its bulk, and in doing so is hindered by the low thermal conductivity of the dried sludge. The direct heating means that water flow from the bulk to the surface of the material is around ten times higher for MW heating than for a thermal convective dryer.
3.2 Specific energy output
Sludge drying rates at a specific energy output (SEO) of 2 MJ kg-1 for output powers of 1 to 6 kW (Fig. 5) indicate that the sludge drying rate increased linearly with increasing MW output power. Hence, the MW sludge drying process is governed by the rate at which energy is delivered to the sludge rather than by the SEO. The treatment of the sludge at higher MW output powers (at the same energy output) resulted in faster drying (lower exposure time), increasing the potential system capacity. The faster drying results from both the MW system delivering more energy per unit time (i.e. a higher MW output power) and the sludge absorbing more energy per unit time and unit volume (a higher sludge power absorption density).
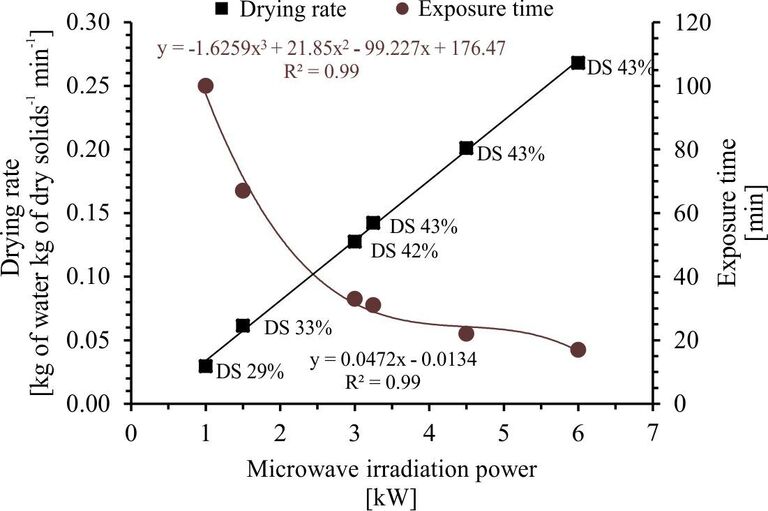
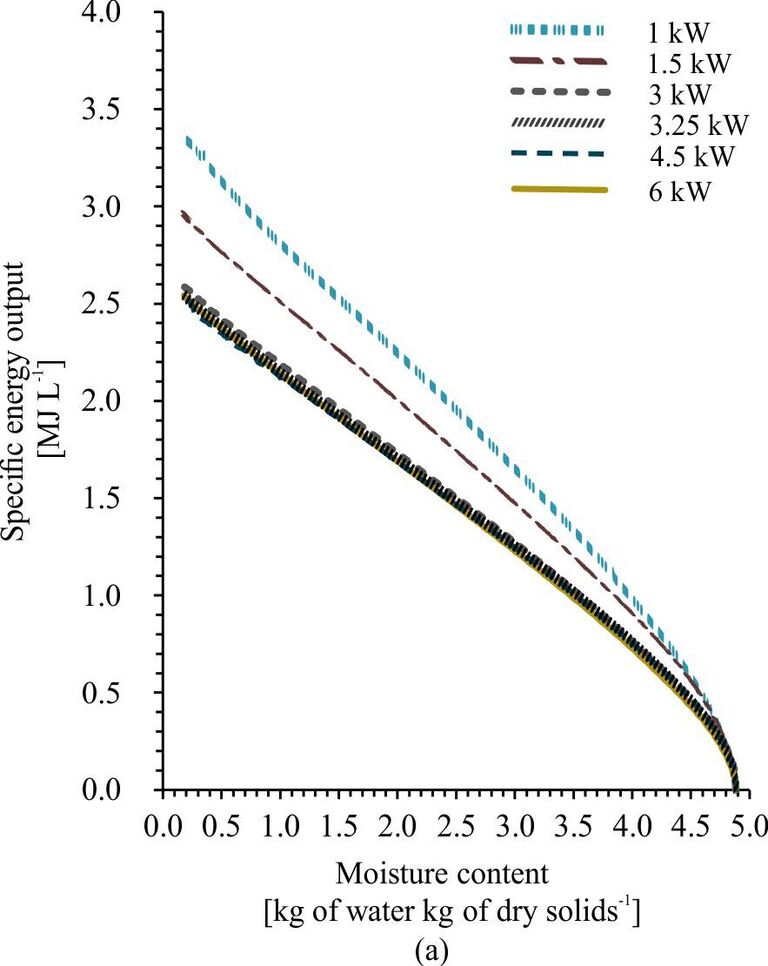
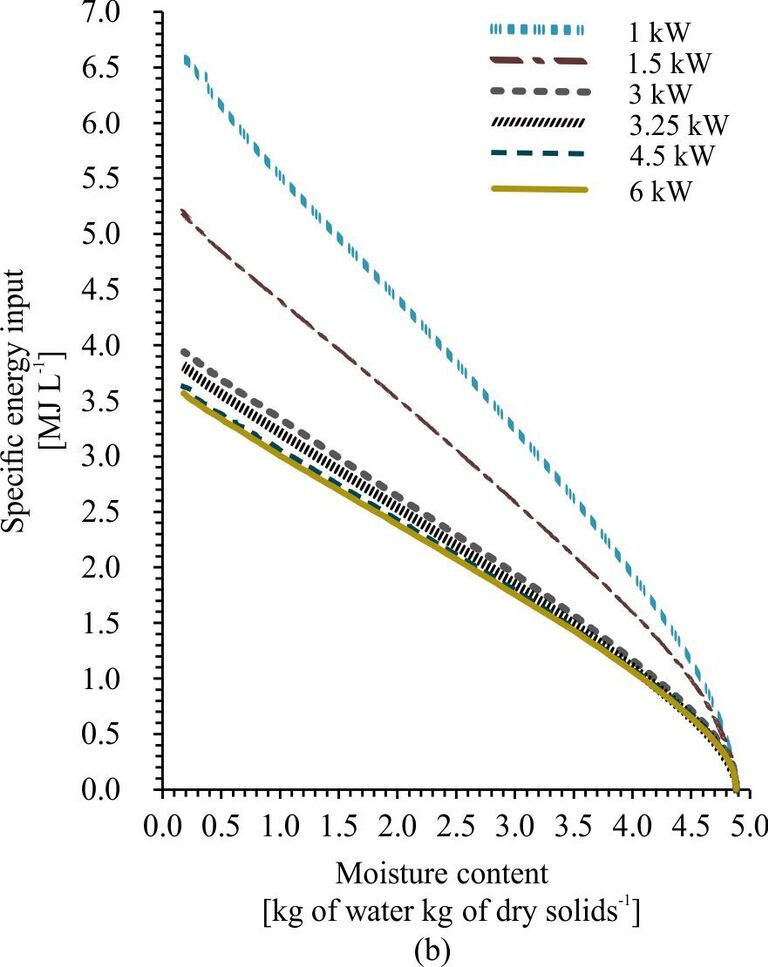
The process efficiency therefore increases with increasing power. This is directly reflected in the SEO and SEI trends with moisture content (Fig. 6), where lower values were recorded at increased power inputs. This lower energy demand arises from the higher power absorption density experienced by the sludge at the higher output powers, minimising potential thermal losses.
3.3 MW generation efficiency, energy efficiency, and specific energy consumption
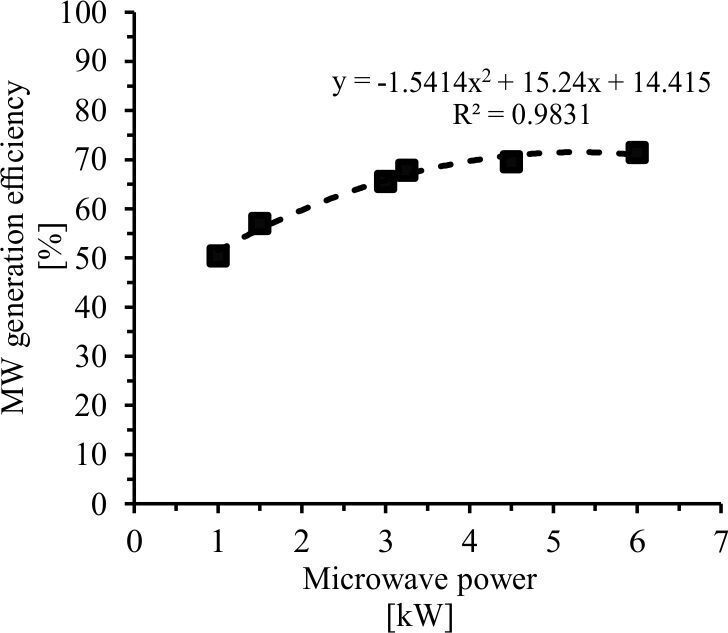
The MW energy generation efficiency (µgen), i.e. the ratio of the energy delivered and energy consumed, increased with increasing MW power (Fig. 7). This confirms that the process operates most efficiently at the highest power applied (6 kW).
The energy efficiency (µen), the ratio between the theoretical energy demand for water evaporation and the actual energy consumed by the MW unit, exhibited a maximum at a moisture content of around 3.8% (Fig. 8). Overall, energy efficiency increased with output power, replicating other trends.
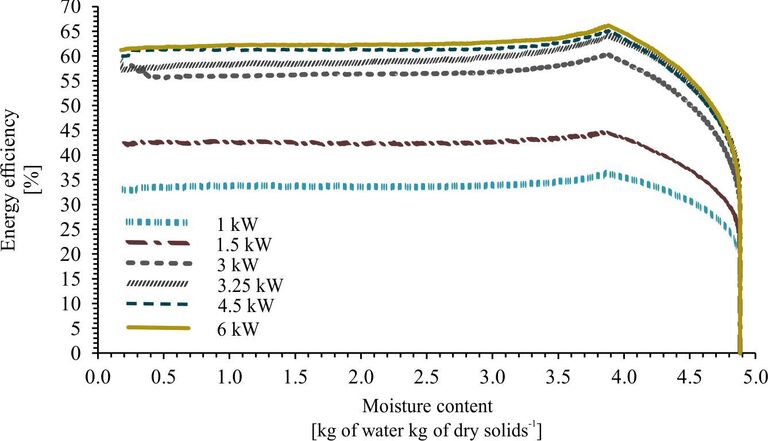
The shape of the curve is consistent with the drying trends depicted in Figure 4. At the highest moisture content the applied energy is used primarily to heat the water, producing no evaporation and thus generating a vertical trend in energy efficiency with moisture content. The slope becomes increasingly shallow until the energy efficiency reaches a maximum, in this case at 3.8 kg water/kg DS (i.e., 21% DS), beyond which (from 3.8 down to ~0.2 kg water/kg DS) the drying rate and associated efficiency are both constant.
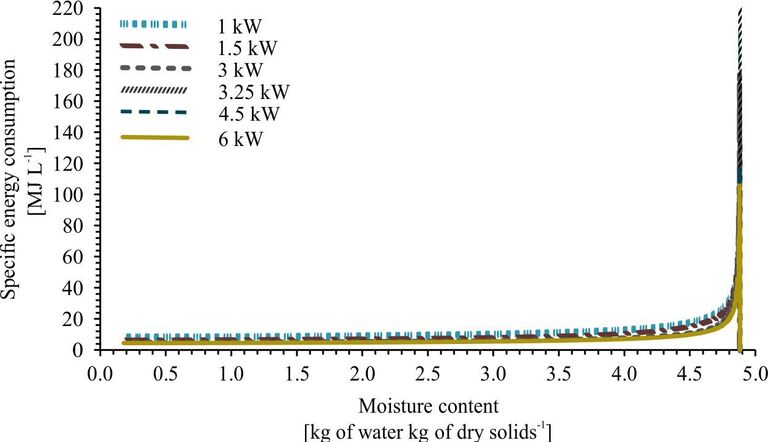
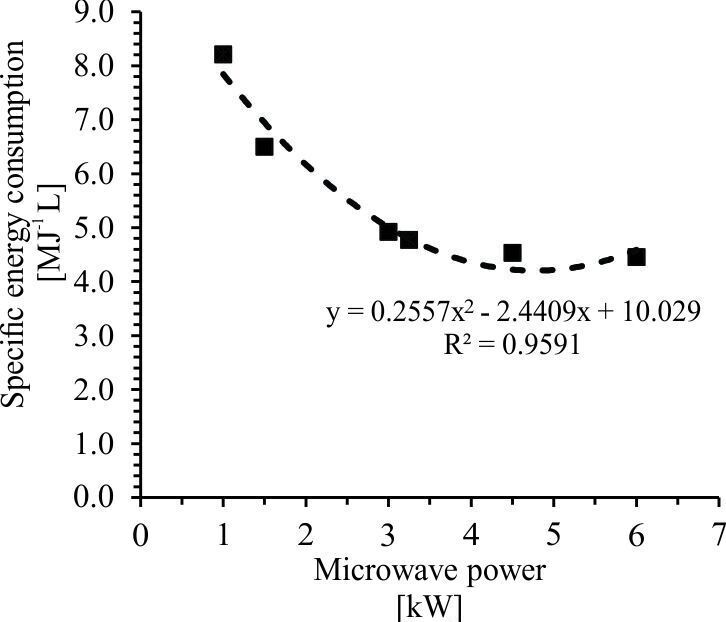
Lastly, the specific energy consumption (SEC) in terms of MJ per L water removed (Fig. 9) shows a similar trend to the energy efficiency, with the highest values at the highest water content when the energy applied heats rather than evaporates the water. The lowest SEC values (4.5−8.5 MJ L-1, or 1.25 to 2.36 kWh L-1) across the range of output powers employed arose at the lowest moisture content, with SEC decreasing with increasing applied power in keeping with other energy trends (Figs. 7−8). The trend in SEC with MW power (Fig. 10) mirrors that of the MW generation efficiency (Fig. 7).
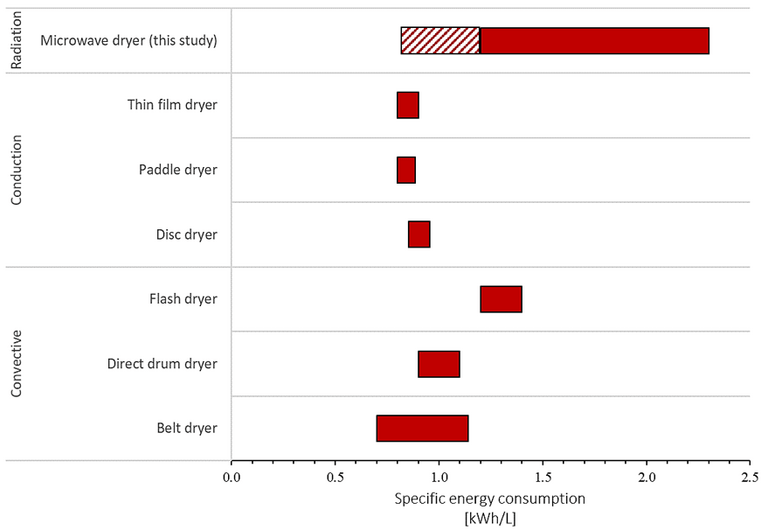
A consideration of the SEC for the various different types of thermal dryers (Fig. 11) indicates the range of values measured in this study to be slightly higher than that reported for thermal dryers. However:
- The measured MW SEC incorporates the energy expenditure required to initially heat the sludge moisture to evaporation temperatures, theoretically equating to ~0.38 MJ (0.1 kWh). This demand can be met by the latent energy of the water vapour generated, ~0.82 kg vapour per kg of raw sludge. Based on an MW generation efficiency of 60%, heating the sludge with the condensate could provide SEC savings of 0.63 MJ (0.17 kWh) per L of evaporated water, reducing the overall SEC to ~3.9 MJ L-1 (1.1 kWh L-1).
- By using full-scale industrial MW generators, MW generation efficiencies can potentially be increased to ~90%, further reducing the SEC to ~2.6 MJ L-1 (0.74 kWh L-1). At this value, MW drying becomes comparable in energy efficiency to conventional thermal processes (2.5−5.0 and 2.9−3.4 MJ L-1 for convective and conductive dryers respectively, Fig. 11).
4. Conclusions
The pilot scale study of the microwave (MW) sludge drying technology has indicated that the nature of the MW drying mechanism can potentially offer energy efficiencies compared with conventional thermal dryers. For these to be realised the latent energy of the extracted water vapour must be harnessed and the MW generation efficiency maximised, as well as avoiding rewetting of the dried sludge by the condensate.

