Co-processing of sewage digestate by hydrothermal carbonisation

Kiran Parmar1, Aaron Brown1, James Hammerton1, Miller Alonso Camargo-Valero2,3, Louise Fletcher2 and Andrew Ross1
This article concerns the hydrothermal carbonisation co-processing of sewage sludge digestate with various available biomass sources, and comparing the characteristics of the hydrochar product from co-processing with those from the isolated biomass and digestate streams. The work was conducted a bench scale over a range of operating temperatures.
1Aqua Consultants Ltd/ School of Chemical and Process Engineering, University of Leeds, Leeds LS2 9JT, UK; 2BioResource Systems Research Group, School of Civil Engineering, University of Leeds, Leeds LS2 9JT, UK; 3Departamento de Ingeniería Química, Universidad Nacional de Colombia, Campus La Nubia, Manizales 170001, Columbia
1. Introduction
Hydrothermal carbonisation (HTC) can be integrated with anaerobic digestion (AD) for treating digestate, the waste stream from the AD process. HTC generates a solid hydrochar and a process water stream, which can be recirculated back to the AD influent (Fig. 1).
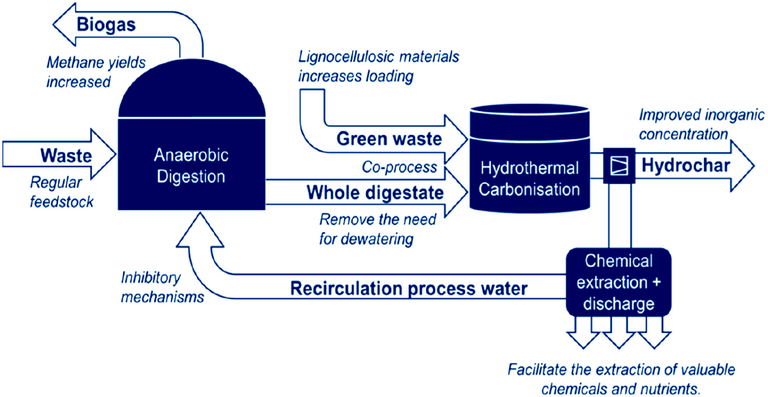
However, the properties of sewage sludge-derived digestate do not favour the production of high-quality hydrochar; blending with lignocellulosic (or plant-based) feedstocks, which have a higher carbon and lower ash content, can improve the hydrochar product properties. A study has been conducted where sewage sludge digestate has been blended with three lignocellulosic biomass sources for co-processing. The aim was to quantify the impact of the blended material composition and HTC process conditions on both product hydrochar yields and the char and process water characteristics.
2. Materials & methods
Dewatered AD digestate was obtained from a nearby wastewater treatment works, where the AD treated primary and secondary sludge. The three lignocellulosic biomass sources comprised locally-sourced grass cuttings, privet hedge twigs from pruning, and woodchip from logging operations. All materials were milled to a particle size below 2 cm prior to blending.
HTC reactions were performed at temperatures of 150, 200, and 250°C for a 1 h on 40 g of oven-dried biomass suspended in 200 mL water, using a quartz silica-lined 600 mL stainless steel reactor. Following cooling, the gaseous products were vented, and the solid residue filtered off, air-dried overnight and then finally oven dried at 60°C for ~48 h to remove all water.
The feedstocks were analysed for their inorganic matter (using X-ray fluorescence spectroscopy), protein content (estimated from the total elemental nitrogen), and proximate analysis. Thermogravimetric analysis provided values for the calorific content, or higher heating value (HHV, in MJ/kg), for the feedstocks and hydrochar products, and so:
- the energy densification (ED) - the ratio of the hydrochar to biomass HHV - and
- the energy yield (EY) - the ED x hydrochar yield.
The process water was analysed for total organic carbon (TOC), chemical oxygen demand (COD), CHNS elemental content and total solids (TS), as well as the biomethane potential (BMP) in NmL methane per g volatile solids (VS). Biodegradability was calculated as the difference in process water residual COD following the BMP measurements minus the inoculum COD added.
3. Results
The key difference between the lignocellulosic biomass and the SS digestate is the lower ash content of the lignocellulosics (Table 1): ~50% for the digestate cf. 7−12% for the biomass. The relative ash, cellulosic, hemicellulosic and protein content follow the sequence:
- Ash: digestate >> grass > privet ~ woodchip
- Cellulose: woodchip >> privet > grass >> digestate
- Hemicellulose: grass >> woodchip > privet >> digestate
- Protein: grass > digestate >> privet >> woodchip
| Parameter | Basis | SS digestate | Grass | Privet | Woodchip |
|---|---|---|---|---|---|
ar = as received basis, wt%. db = dry basis, wt%. daf = dry ash free basis, unitless ratio. VM volatile matter. | |||||
| Protein | ar | 19.9 | 21.1 | 6.7 | 2.2 |
| Cellulose | ar | 5.8 | 23.2 | 20.5 | 32.8 |
| Hemicellulose | ar | 4.9 | 22.6 | 9.4 | 13.9 |
| Lignin | ar | 17.3 | 3.5 | 10.2 | 21.7 |
| C | db | 28.6 | 45.6 | 46.7 | 49.6 |
| H | db | 3.1 | 5.3 | 5.6 | 6.4 |
| N | db | 3.4 | 3.5 | 1.1 | 0.4 |
| S | db | 1.5 | 0.1 | 0 | 0 |
| O | db | 16.4 | 33.2 | 39.4 | 36.9 |
| VM | db | 51 | 71.1 | 76.7 | 76.1 |
| Ash | db | 46.9 | 12.4 | 7.2 | 6.8 |
| H/C | daf | 1.3 | 1.37 | 1.42 | 1.55 |
| O/C | daf | 0.43 | 0.55 | 0.63 | 0.6 |
| HHV, MJ/kg | db | 14.9 | 18.4 | 18.6 | 19.9 |
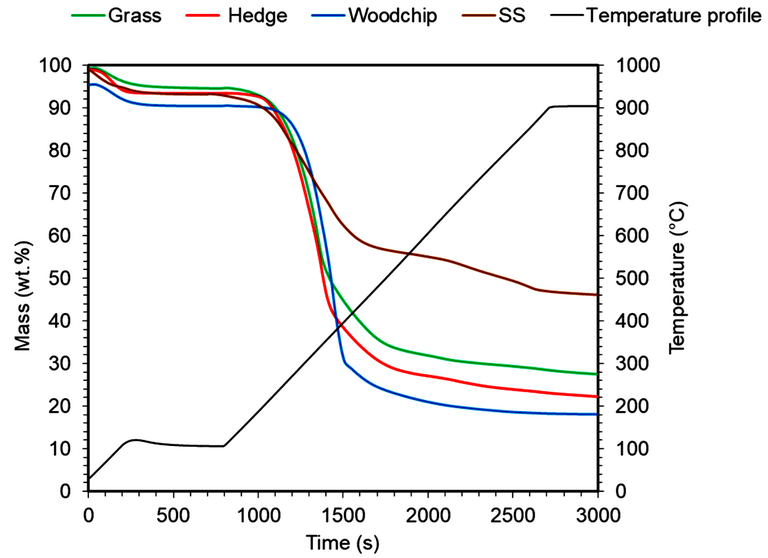
The thermogravimetric analysis, i.e. mass loss with time on ramping the temperature, indicates the biomass samples to significantly and rapidly degrade between around 250–400°C (Fig. 2), associated with the lignin, cellulose and hemicellulose content of these materials. The digestate degrades more slowly and over a wider temperature due to its higher ash content.
For the co-processed (50/50) feedstocks averaged yield data indicate:
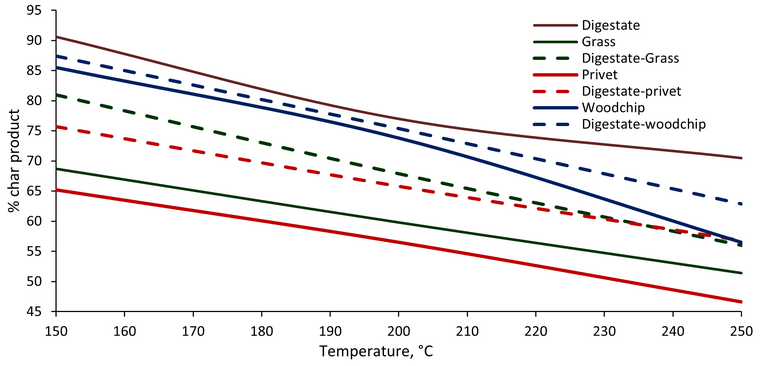
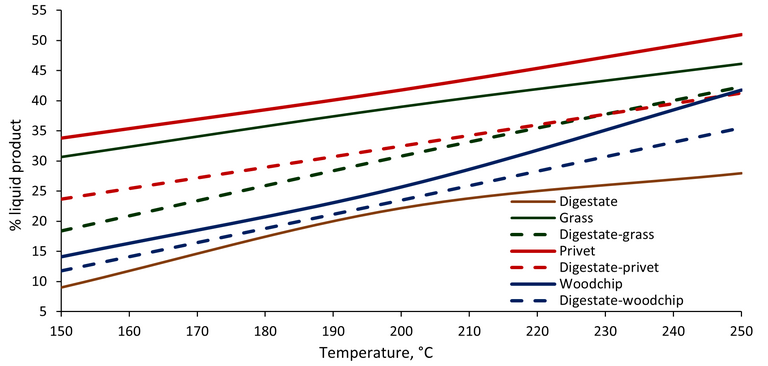
- The yield of solid hydrochar product decreases with temperature (Fig 3a) whilst solubilisation in the liquid fraction increases (Fig. 3b), the relationships being roughly linear;
- The hydrochar yields generally follow the order digestate > woodchip > grass > privet (Fig. 3a), whereas solubilisation of the feedstocks into the process water follow the opposite trend (Fig. 3b);
- The yields of hydrochar from SS digestate are significantly higher than the lignocellulosic biomass across all temperatures due to the higher ash content (Fig. 3a);
- Of the three lignocellulosic biomasses, the yield of hydrochar follows the order woodchip > grass > privet (Fig. 3a), with woodchip being the most recalcitrant to degradation based on solubilisation in the liquid fraction (Fig. 3b);
- Co-processing of the 50/50 blends of the different lignocellulosic biomass with digestate leads to yields between those of the biomass and the digestate in all cases (Fig. 3ab).
- The overall yields are largely additive, suggesting that there is no significant catalytic effect of the ash during blending.
Hydrochar composition data (Table 2) reveals:
- The ash content of digestate hydrochars is significantly higher (39−49%, increasing with temperature) than that of the lignocellulosic biomass hydrochars (20−27% privet, 10−14% grass, 1.8−3.3% woodchip);
- The hydrochar HHV increases with temperature for all biomass samples, whereas it is lower and remains unchanged (15.2 MJ/kg) with temperature for the digestate hydrochar;
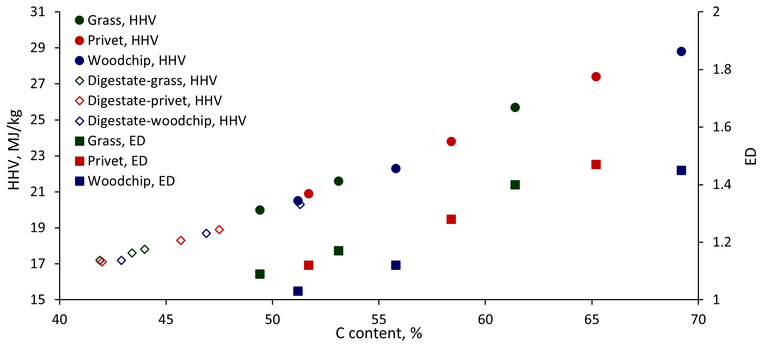
- The HHV is linearly related to the hydrochar C content independent of the matrix (Fig. 4), the maximum value being 28.8 MJ/kg at 250°C for the woodchip-derived hydrochar;
- The ED also increases linearly with the C content, but the value is dependent on the matrix with the woodchip values being slightly lower than those of the privet and grass (Fig. 4);
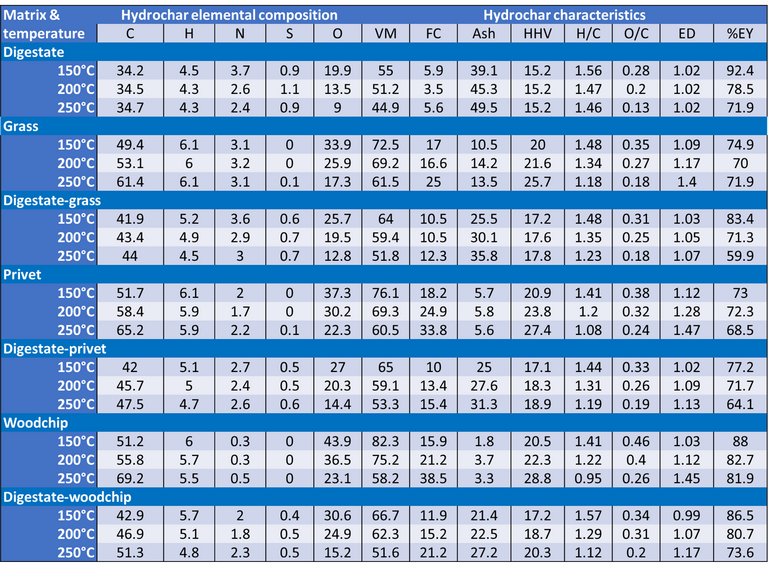
- The nitrogen and sulphur levels are highest in the digestate hydrochar reflecting the higher protein content: the N content decreases with increasing temperature from 3.7 wt.% at 150°C to 2.4 wt.% at 250°C whereas the S content remains stable at ~1 %;
- For the lignocellulosic feedstock, the N levels are highest in the grass-derived hydrochar, reflecting its high protein content, and remains relatively stable at ~3.1% at all temperatures;
- The N levels of the privet-derived hydrochar are lower (2 and 2.2% for 150 and 250°C, respectively), and in the woodchip hydrochar are considerably lower (0.3 and 0.5 wt.%), in line with the lower nitrogen content in the feedstock;
- The N levels in the co-processed samples are slightly higher than the weighted values based on additive behaviour (Fig. 5), particularly at the higher temperature and for the woodchip: this is possibly to the detriment of the hydrochar as a fuel but beneficial if used for soil amendment;

- The relative ash content of the lignocellulosic hydrochars follows the sequence grass > privet > woodchip, similar to the feedstocks, with the co-processed samples having ash content values between that of the digestate and biomass hydrochars;
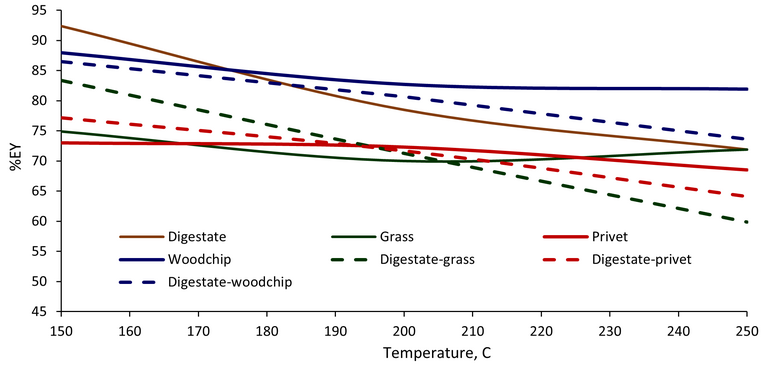
- Both the hydrochar ash levels and the energy densification (ED) are roughly additive (Fig. 6), with some deviation at the highest temperature; the exception is for the digestate-privet blend, where the experimentally-measured ash content is higher and the ED lower than the additive value for the woodchip;
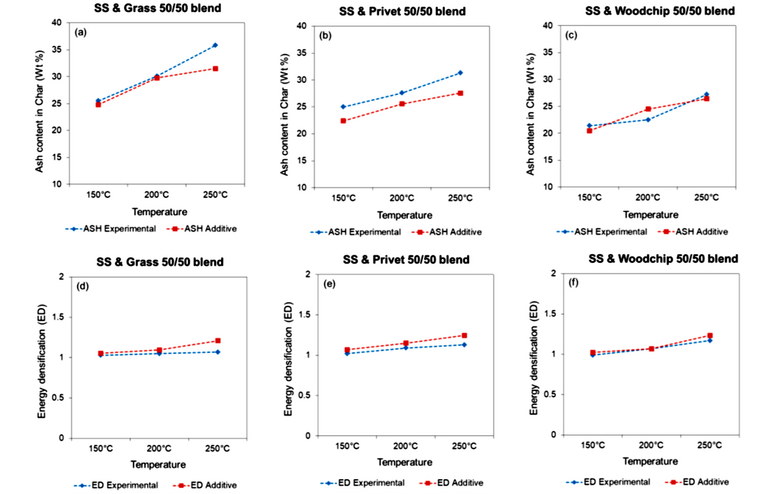
- The rate of reduction in energy yield (EY) with temperature is greater for the co-processed materials than the unblended ones, especially for digestate and grass (Fig. 7);
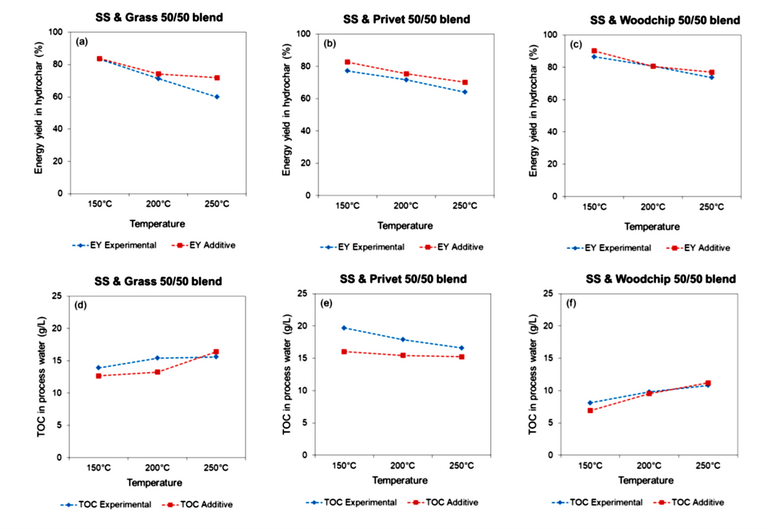
- The experimentally determined EY is lower at the highest temperature than the additive value for all co-processed materials (Fig. 8a−c), possibly associated with increased loss of TOC into the process water (Fig. 8d−f).
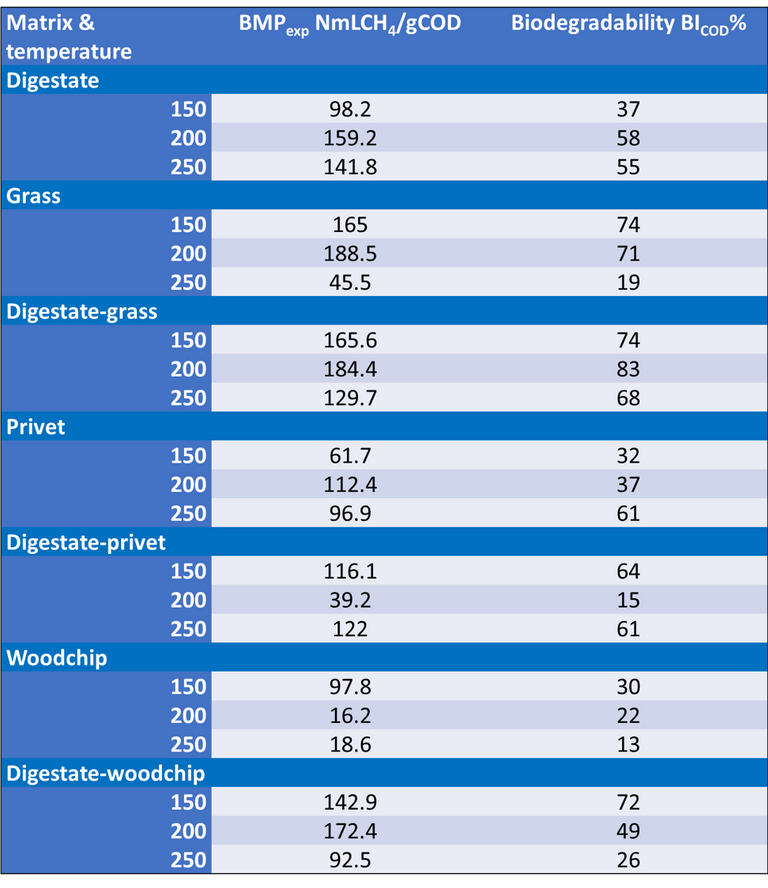
Analysis of the process water data (Table 3) indicates:
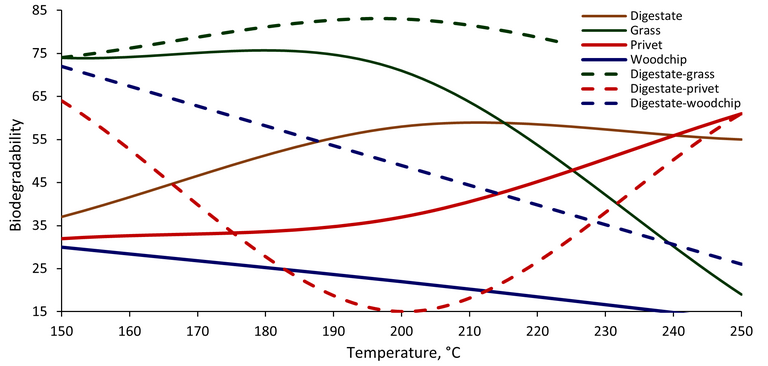
- Trends in biomethane production with temperature vary significantly between the different feedstocks (Fig. 9), with production peaking for process waters from hydrochar production at 200°C for all feedstocks other than woodchip and the digestate−privet blend;
- The largest BMPexp of >180 NmLCH4/gCOD was obtained from the grass and digestate-grass blend for process waters from hydrochar production at 200°C;
- BMP appears to be inhibited for process waters from hydrochar production above 150°C for the woodchip feedstock;
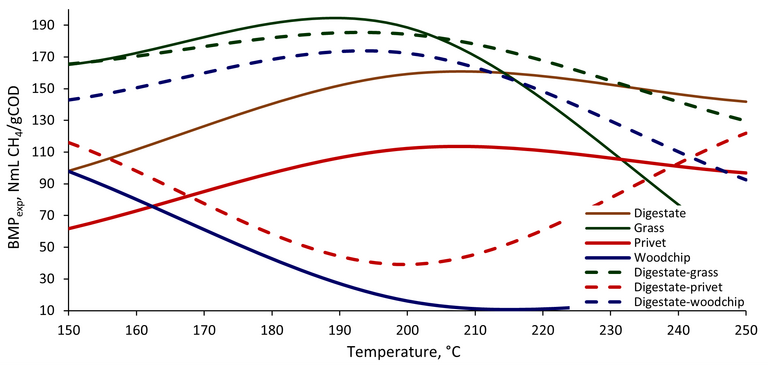
- Following co-processing, the process waters from co-processed materials all have higher BMP values than for the feedstocks in isolation at a temperature of 250°C – particularly for woodchip: this suggests that the digestate improves biodegradability, as indicated by the biodegradability trends for the woodchip and grass feeds and blends (Fig. 10).
4. Discussion
The outcomes from the co-processing experiments suggest that there may be some interaction between the inorganics in the feedstocks, leading to small changes in the co-processed hydrochar values compared with those determined from the additive values of the separate feedstocks. These changes include:
- higher than expected nitrogen levels (Fig. 5), either through chemical reaction or surface adsorption,
- slightly lower energy yields (Fig. 8a−c), corresponding to higher-than-expected TOC levels in the process water (Fig. 8d−f) and suggesting increased solubilisation of organic carbon in the process water, and
- significantly different biomethane generation trends for the process waters produced, with predominantly higher BMP associated with the co-processed materials compared with the isolated biomass feeds.
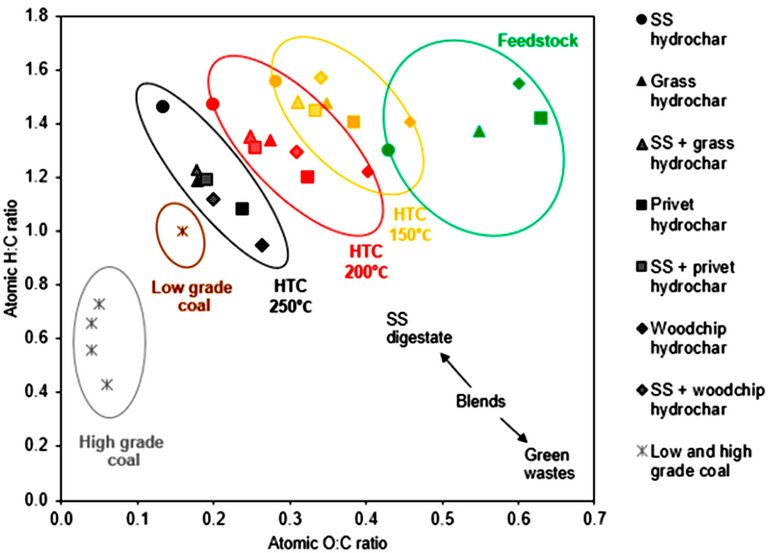
The van Krevelen plot (H:C vs. O:C atomic ratios) for the feedstocks and hydrochars (Fig. 11) indicates that at the three temperatures employed the digestate hydrochar exhibits a higher H:C and lower O:C ratio compared to the biomass hydrochars. This suggests that higher inorganic content feedstocks favour decarboxylation reactions, compared to lower inorganic content feedstocks which favour dehydration reactions. The blended hydrochars produced at 250°C exhibit a similar H:C/O:C ratio to that of a low-grade coal. The blending of lignocellulosic biomass with sewage digestate reduces the hydrochar H:C ratio yet reduces its O:C ratio compared to processing biomass alone.
5. Conclusions
A study of the hydrothermal carbonisation (HTC) of digestate and lignocellulosic biomass blends has revealed:
- co-processing of the two feedstocks does not always result in additive behaviour in the characteristics of the hydrochar generated,
- the nitrogen and ash content are higher than the additive value indicates, particularly at high temperatures,
- the higher heating value is linearly related to the carbon content, regardless of the matrix,
- the preferred co-processing combination is likely to depend on the end use of the hydrochar, with an increased nutrient content (N, P, and K) favouring soil additive applications but increasing NOx emissions if used as a fuel, and
- the biomethane formation potential of the process water generated from HTC is significantly changed by co-processing compared with processing the isolated lignocellulosic biomass feeds.


